How Digitilization and 3D Printing Shaping Construction Industry

For the past forty years, the construction sectors have been going through the inefficiencies in productivity that erode them. Following outlines 6 key factors that damaging construction productivity (Dozzi, S.P., and AbouRizk, S.M., 1993):

  1. External events: bad weather
  2. Market condition: supply chain
  3. Design and procedure phase: schedule changing, design cost information outdated
  4. Construction management/ Labor: ineffective communication, construction site document is scattered for different stakeholders
  5. Government policy: issues of permits( in a report from Mckinsey, it takes less than 100 days for Taiwan government to  complete all permitting and approval procedures)
  6. Education and training: insufficient training of management personnel

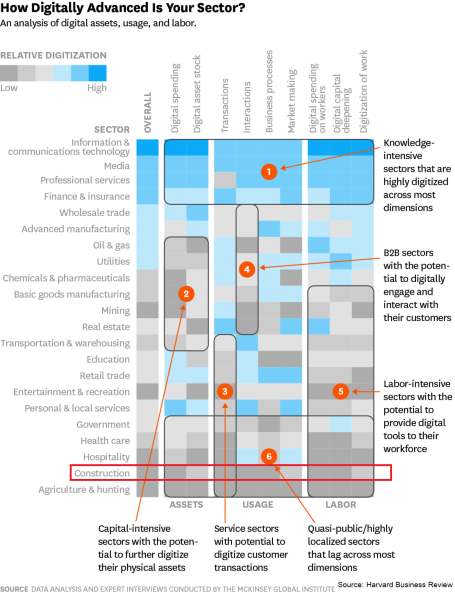
Digitalization is, therefore, a key element of the improving productivity and create opportunities for new business models. However, based on a report from Mckinsey in 2016, Real estate and construction industry have been a laggard when it comes to digitalization.

vv

The industry is currently under its way of sketching the digital environment that could vertically and horizontally integrate the data.

Next, I will highlight four most mentioned opportunities for digitalization in construction, and of course, there are the diverse array of digital opportunities other than these four (Roland Berger, 2016):

vv

The End Users of the Buildings

Airbnb and WeWork are probably two prominent examples of how the platform economy changing the way people connecting with real estate and construction. WeWork architects and constructs office spaces. And it is changing the nature of work life. A building is like an object that creates useful data that affect how WeWork designs and manages offices. Each day, WeWork receive feedback from the users through their platform and tracks how users travel and utilize the buildings. Airbnb, on the other hand, is the largest apartment rentals platform that is disrupting the traditional hotel services.

Let’s Talk about BIM

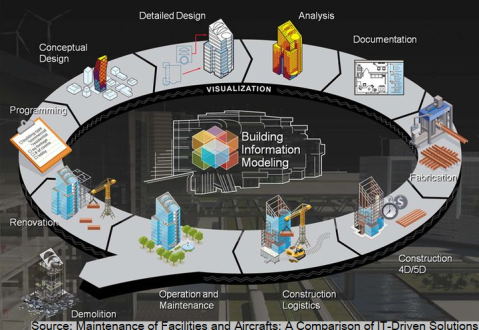
BIM (Building Information Modeling) is the cutting-edge techniques used in architecture which aims to optimize the management of buildings life cycle. Before entering the physical construction stage, users can simulate and analyze potential impacts on software in advance to reduce unnecessary cost. After the construction completed, the building’s data can then be transferred to facility management (FM), and hence to improve the productivity and maintainability.

BIM has been in the construction industry since 1970. From the most common 3D BIM, 4D BIM (plus scheduling data) to 5D BIM (plus cost information).vv

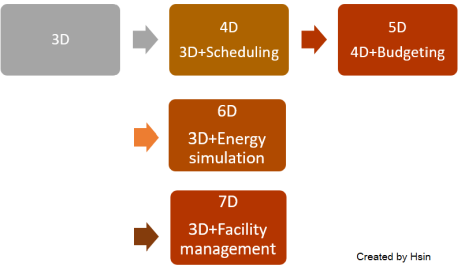
The core idea of BIM is information. It is not about “tool” itself, or modeling, but the sharing of information during the building life cycle.

vv.png

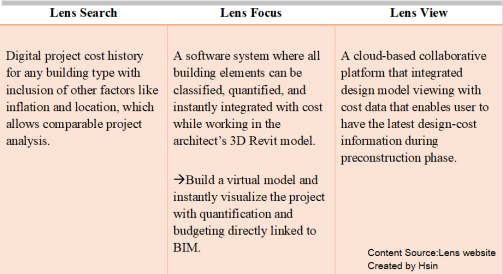
BIM exists for a long time, and the adoption of BIM plays a crucial step towards digitaliization nowadays as an enhancement. JE Dunn, is a U.S. based construction company, partnered with Autodesk to develop custom visualization technology known as Lens. Lens is a platform that accelerates continuous estimating and collaboration throughout the preconstruction phase.

vv.png

More about 3D Printing

Everyone knows 3D printing. Recently, there have been developments in the field of prefabrication. Contour Crafting, a construction printing technology developed by Dr.Behrokh Khoshnevis at the University of Southern California, is scaling up 3D printing techniques.  It is said to have a significant deduction on waste and cost. Users can customize their building design through their technology, including 3D-printed pipes and other structures.


Construction matters for world’s economy. By 2030, it is expected to expand by 85% to $15.5 trillion. Future seems bright for the construction industry with adopting new technologies and at the same time, innovates how people interact with buildings.

Reference:

Gandhi P., Khanna S., and Ramaswamy S. (2016) Which Industries Are the Most Digital (and Why)? Available at: https://hbr.org/2016/04/a-chart-that-shows-which-industries-are-the-most-digital-and-why

Dozzi S.P., and AbouRizk S.M. (1993) Productivity in Construction. Available at: http://web.mit.edu/parmstr/Public/NRCan/nrcc37001.pdf

Parhiala K., Yalcinkaya M., and Singh V. (2014) Maintenance of Facilities and Aircrafts: A Comparison of IT-Driven Solutions.  IFIP Advances in Information and Communication Technology, vol 442.

Roland Berger (2016) Digitization in the construction industry.

McKinsey & Company (2017) REINVENTING CONSTRUCTION: A ROUTE TO HIGHER PRODUCTIVITY.


When AR Meet Industry 4.0

“If you have an apple and I have an apple and we exchange these apples then you and I will still each have one apple. But if you have an idea and I have an idea and we exchange these ideas, then each of us will have two ideas.”—-George Bernard Shaw

I believe this best describes the situation of AR+IoT.

What is the difference between AR(Augmented Reality) and VR(Virtual Reality)?

The history of VR can be related to the pioneer of human-computer interaction (HCI), Ivan Sutherland, who created Sketchpad system in 1963 for his Ph.D. thesis. The system was among the first graphical user interfaces aimed to make computers more accessible to both the artist and the technician. However, not until 1987 when the term virtual reality was coined. The user of VR put on a headset that blocks out the worldview and brings the user to an entirely digital environment. The famous application including HTC Vive and Oculus Rift.

Now, let us turn to AR. Unlike VR, the idea of idea AR is not to cut off the real world but instead to be an enhancement on users surrounding with a set of virtual object or digital data overlapping the user’s real environment. The famous example of AR would be Pokemon Go or any lens face filter.55.png

In a Smart Manufacturing Context

While most applications of AR/VR are mentioned in the context of consumer entertainment, the adaption in manufacturing, medicine, logistics or even crime scene investigation (CSI, remember?) also show the enormous benefit. PTC(NASDAQ: PTC) is a computer software company located in Boston. Many big-name OEM, and ODM manufacturers, including Taiwan’s Honhai Precision, is among PTC’s clients. At 2017 LiveWorx, the President of PTC, James (Jim) Heppelmann, talked about the concept of digital twin and how AR can be the tool to put the information that stored in the cloud into the physical workplace/ field and hence make various aspects of that digital twin visible to the user.
55

A study made by Sääski J. et al.(2008) finds that users with AR made an average ten times fewer errors during the task which enables workers to improve the performance. In a most recent company case, General Electric (NYSE: GE), sees an efficiency improvement after applying AR in GE Healthcare. With no doubt, AR is taking maintenance, preventive and predictive procedures to the next level.


References:

Kellner T. (2017) ”Game On: Augmented Reality Is Helping Factory Workers Become More Productive” GE Reports.

Porter, Michael E., and James E. Heppelmann.(2017) “Why Every Organization Needs an Augmented Reality Strategy.”Harvard Business Review 95, no. 6, 46–57.

Sääski J., Salonen T., Liinasuo M., PakkanenJ., Vanhatalo M., and Riitahuhta A.(2008) “Augmented reality efficiency in manufacturing industry: A case study”, Proc. NordDesign Conf., 99-109


Principal Component Analysis of 6 Assets

This is followed by the previous blog post DCC GARCH (1, 1) Time-varying Correlations

I use principal component analysis to extract the orthogonalized representation of risk factors from our six assets. The Principal Component Analysis is implemented with a 60-month rolling window to derive the PC from the assets every month. With no doubt, PC 1 dominates most of the total variance.PC2

Now, let’s have a look of factor loadings. I do not try to interpret such PCA factors. Nevertheless, PCA is used in many empirical studies to detect the number of common styles in strategies. Hence, understanding PCA can help to find the similarities and differences between each asset return. The sign of PC is irrelevant, but it tells the variation in return series.

Rplot03

DCC GARCH (1, 1) Time-varying Correlations

This topic is actually extracted from a part of my thesis, but I find it interesting  : D

The data is obtained from Datastream by Thomson Reuters, from February 1988 to November 2017. I include three asset classes/ six assets into my portfolios, they are:

S&P 500(SPCOMP), Russell 2000(FRUSS2L), S&P GSCI Crude Oil(GSCLTOT), S&P GSCI Gold(GSGCTOT), BofA US Corporate Index(MLCORPM), BofA Global Government index(MLGGALM)

Below presents the DCC-GARCH (1,1) time-varying correlations between each asset returns. Correlations among same asset classes are greater than 0 of all time. We can also see that gold can be a safe haven for the market index during the crisis that happened inside our sample period. Unfortunately, crude oil is not the case.

Untitled

Below plots the cumulative returns for the assets over the full sample period. Please note that the cumulative returns are calculated from simple returns (provided that the return is relatively small, such as monthly or daily returns, simple returns are very similar to log returns. But generally, simple returns have higher means and higher variance than log returns). Among all the assets, only Russell 2000 and S&P 500 have the highest cumulative return at around 20%.

Rplot01

Below is DCC-GARCH (1,1) time-varying variance of each asset. It shows that Russell 2000 and S&P 500 increase at the time of the dotcom bubble in early 2000 and the financial crisis in 2008. The variance of S&P GSCI Crude Oil reaches its highest peak at more than 0.08 during the period from 1990 to 1992. After the Gulf War, crude oil prices steadily declined, reaching their lowest level. Variances of all the assets in this study spike in the financial crisis. Overall, BofA Global Government index has a more stable variance and still remain low even crisis occur. BofA US Corporate Index also has a small variance except in 2008 which reach the top at 0.001.

Rplot27.png